To study water quality, scientists study both chemistry (what is dissolved in the water) and biology (what is alive in the water). Chemical monitoring provides a “snapshot” of the condition of the stream at the time the sample is collected. In contrast, the living organisms show what is happening in the stream over a period of time.
The most commonly studied organisms in streams are fish, algae, and benthic macroinvertebrates. Of these groups, the macroinvertebrate community is the most commonly used because:
- They are fairly easy to sample and identify.
- They are sensitive to pollution and changes in their habitats.
- They have a relatively long life cycle and so are indicators of water quality over a period of time.
- They are common in most streams or rivers.
Biotic Index
Through controlled experiments and field observations, scientists have learned that some aquatic organisms are particularly sensitive to specific types and levels of pollutants. Many freshwater invertebrates require a specific range of physical and chemical parameters to flourish. The presence or absence of these organisms, along with their abundance in a stream, can be used to reveal overall water quality.
Biotic indices are a widely used method of using a scale to indicate organic and nutrient pollution based on the abundance of organisms with known tolerances to environmental stress. There are many variations of biotic indices across the United States and around the world that have been developed to interpret regional differences in taxa sensitivities. The biotic indices in the Leaf Pack Stream Ecology Kit — the Pollution Tolerance Index Score and the Pollution Tolerance Index Rating — are created from a select subset of indices from across the United States.
Each organism is assigned a sensitivity group (1, 2, or 3) depending on the organism’s ability to tolerate stressors such as pollution or lack of habitat within the stream. The organisms that are very sensitive are in Group 1 (sensitive), those that are somewhat sensitive are in Group 2, and those that can survive or tolerate poor water quality are in Group 3 (tolerant).
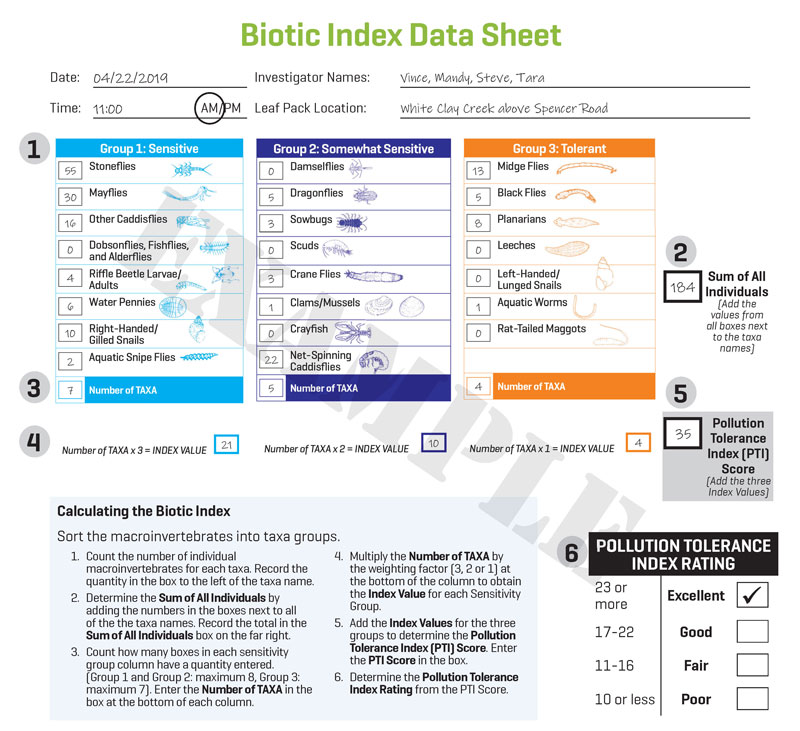
Example Biotic Index Calculation
The following image shows the Leaf Pack Stream Ecology Kit Biotic Index Data Sheet for an example macroinvertebrate sample, including how to calculate its Pollution Tolerance Index Score and Pollution Tolerance Index Rating.
EPT Index
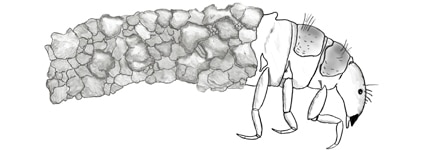
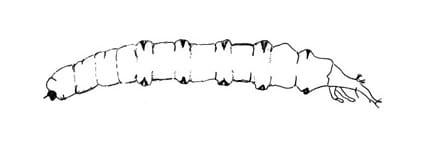
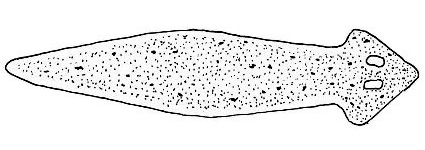
The EPT index is a measure of the percentage of Ephemeroptera (mayflies), Plecoptera (stoneflies), and Trichoptera (caddisflies) found in the total number of macroinvertebrates in a sample. Because these orders of macroinvertebrates tend to be sensitive to pollution, a high percentage of them per sample indicates good water quality.
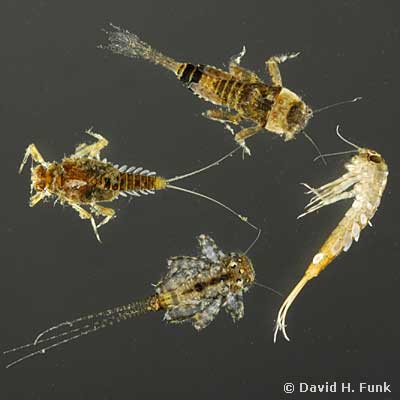
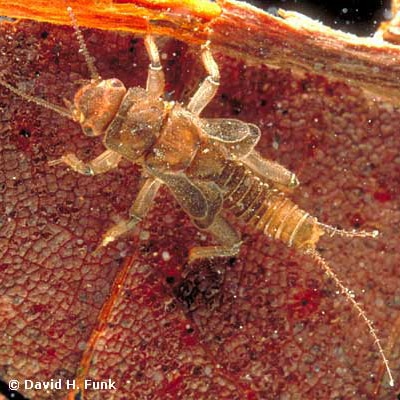
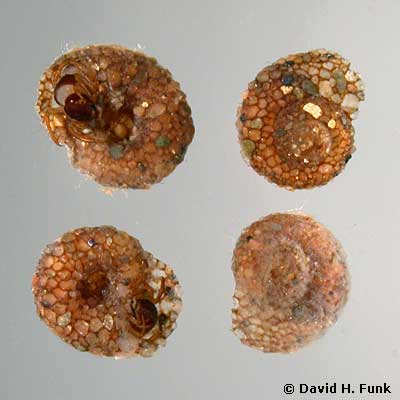
The photos above show mayflies, a stonefly, and case-building caddisflies. You can view dozens more macroinvertebrate photos like these in Stroud Water Research Center’s macroinvertebrate photo gallery.
Calculating the EPT Index (as a Percentage)
- Add together the number of Mayflies (E), Stoneflies (P), and other Caddisflies (T) found in the sample. Note: The common net-spinning caddisfly (Hydropsychidae) is not included in the EPT calculation because this one family of caddisflies is not as sensitive to pollution.
- Divide the EPT Total by the total number of all macroinvertebrates in the sample.
- Multiply this number by 100 to convert it to percent. This is the EPT Index value. The higher the percentage, the better the water quality.
How Healthy is Your Stream?
We strongly encourage you to share your Leaf Pack Network data on Monitor My Watershed to help advance knowledge and stewardship of freshwater systems around the world. When you share your data on the portal your biotic and EPT indices will be calculated for you. If you choose not to share your data, you may use the Biotic Index Calculator to obtain these values.
